KS Tech logo

Master Your IT Skills with KS Technologies

Get certified, learn from industry experts, and advance your career in IT with our professional training courses.
Google Review Image
facebook new rating image
just dial new rating image
Experience icon
0 +
Experience
Students icon
0 +
Students
Courses icon
0 +
Courses

About Us

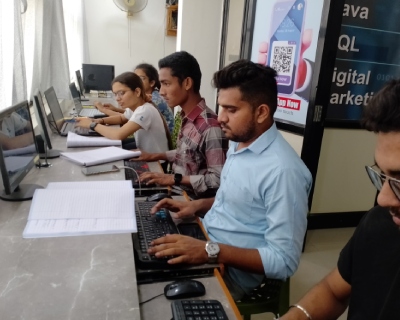
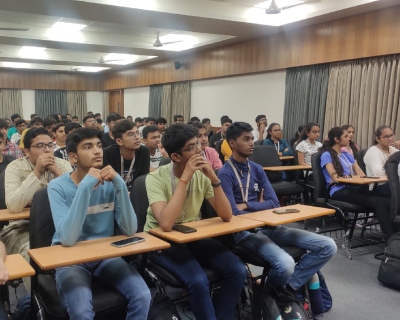
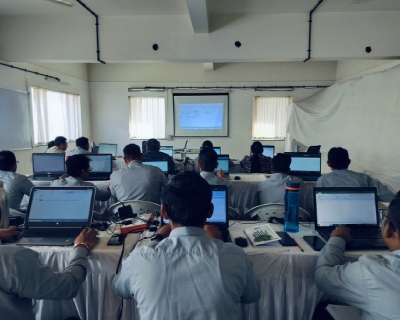
At KS Technologies, we are passionate about equipping individuals with the skills and knowledge they need to thrive in the fast-paced world of information technology. Founded with a mission to provide high-quality, hands-on training, we offer a wide range of courses in programming, cybersecurity, cloud computing, data science, and more. Our curriculum is designed by industry experts and focuses on practical, real-world applications that help our students build in-demand skills.
Whether you’re a beginner looking to start a career in IT or a seasoned professional seeking to upgrade your expertise, KS Technologies provides personalized learning experiences to meet your goals. With a team of certified instructors, flexible learning options, and career support, we ensure that you’re not just learning — you’re preparing for success.

Why choose us?

100% Practical Training icon

100% Practical Training

Expert Mentorship icon

Expert Mentorship

Certification icon

Certification

Home why choose image
Industry based Project icon

Industry based Project

Mock Interviews + Contests icon

Mock Interviews + Contests

Rigorous interview preparation & contests icon

Rigorous interview preparation & contests

Our Popular IT Courses

What will you learn

Meet our Main Mentor

Kapil Bhatia metor image

Kapil Bhatia

CEO & Head Mentor
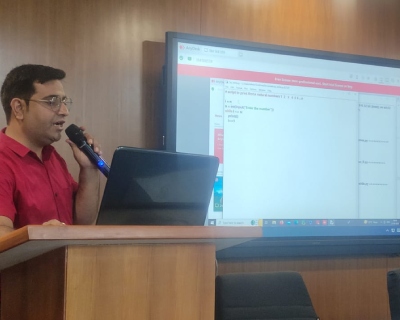
With more than 15 years of training & development experience in the IT industry, Kapil Bhatia brings a wealth of knowledge and a passion for teaching. A certified expert in software development, Website Development, Data Analyst & prompt engineering. He has helped thousands of students and professionals achieve their goals and advance in the fast-paced world of information technology.
Qualifications and Achievements:
  • 15+ years’ experience in the IT industry
  • Corporate Trainer
  • Certified Python Developer
  • Expert in multiple coding platforms
  • Mentored over 10000+ students through career transitions and certifications
testimonials icon

Technology is evolving rapidly, and staying ahead means continuous learning. My goal is to empower students with practical, hands-on experience and the confidence to thrive in the IT field. testimonials icon

What our student’s say:

Shalini Rajmalani
Shalini Rajmalani
Data Analyst
Read More
I have learnt the data analytics course from that I have learnt many new things ie.powerbi,advance excel,SQL,python etc ..Sir method of teaching is amazing from that I got very good experience of learning the course
Mantra Vithalani
Mantra Vithalani
Java Course
Read More
I recently completed KS Technologies's Java course, and it was fantastic! The curriculum was comprehensive, covering both fundamental and advanced topics.
hrishikesh pathak
hrishikesh pathak
Power BI & Excel
Read More
I have learned Advanced Excel, Power BI and My SQL at KS Technologies with Kapil Sir. Sir has taught concept in deep and shown practical aspect which helped in regular job. Great learning highly recommended.
Jadhav Samarth
Jadhav Samarth
Read More
I have completed my advance excel and Power BI certificate course. My experience was fabulous. I got training from basic to advance level from industry experts. I strongly recommend KS Technologies for advance excel and Power BI course.
Tannavee Nayak
Tannavee Nayak
Read More
I have done my certification from here and throughout the course it was a mind-blowing experience. The mentor is very supportive and calm.
Tariro Jim
Tariro Jim
Read More
One of my seniors recommended me to do my internship at KS technologies and I do not regret it. It's has been a great experience and a learning adventure . It is a very welcoming environment, as an international student i haven't faced any communication challenge. I highly recommend KS technologies especially to International students.
Sai Prajapati
Sai Prajapati
Read More
One of the best Experience for learning Coding Language. I started out as a newbie Learning C launguage and fell in Love with the coding. All thanks to superb explanation by Kapil Sir I not only ended up witha lott of amazing coding knowledge but even new experiences. I even learnt c++ language which is considered a bit hard. But with sir's amazing guidance I could complete it in less than a month with cull clarity. I would definitely love to continue learning and even recommend u too.
Ekta joshi
Ekta joshi
Read More
I recently completed my course of Data Analytics,Python, Advanced Python with great experience with Kapil Sir. Highly recommended this institute, those students who are looking for this courses, go through this institute without thinking. The way of teaching and treating is awesome.
Dhairya
Dhairya
Read More
I have completed my Data Analytics course at KS Technologies. The entire journey was superb with Mr. Kapil. They provide practical based training sessions and industry based projects, this helped me in my Master degree here in canada.
Hussain
Hussain
Read More
KS Technologies provides best of the job oriented courses, I have done Data Analytics in which I got best of the skills for job. Thankx a lot team KS Technologies for such a amazing coureses.
Jatin
Jatin
Read More
I have done Python & SQL here for developing my skills and I want to switch my career to IT industry.
Kumail
Kumail
Read More
I am learning coding language C, C++, Python & Java programming with certificate, hands on excercise and practical assignments gives an edge to learn new concepts.
Previous
Next
home tesimonials image
I am writing to express my gratitude and appreciation for the exceptional training at KS Technologies in the C, C++, Java, and Python courses. The curriculum was well-structured, covering fundamental concepts as well as advanced topics, which allowed me to gain a deep understanding of each programming language.
testimonials icon
Khushi Mehta
Certified coding expert
I recently completed a data analytics class that exceeded my expectations. The instructor's expertise, engaging teaching style, and emphasis on practical applications made the course a fantastic learning experience. The comprehensive materials, collaborative environment, and relevance of the content to real-world scenarios were particularly impressive. I highly recommend this class to anyone looking to gain valuable data analytics skills.
testimonials icon
Kaushal Patel
Certified Data Analyst

Where are they now

Our Events and Glimpses

Blogs

Your Degree is Just the Starting Line: Navigating Data Analytics After Graduation

Graduating college is a massive milestone, but stepping into the job market can feel daunting. If you are looking at your degree—whether it’s in B.Com, B.E., BCA, BBA, or even a BSc in a non-technical subject—and wondering how to pivot into a high-paying tech career, Data Analytics is one of the most accessible and lucrative pathways available. Companies across every industry are drowning in data and desperate for professionals who can interpret it. The market is shifting from looking only at generic degrees to looking for specialized “Insight Architects” who know how to solve real business puzzles. Here is your strategic guide to breaking into Data Analytics immediately after graduation. Does Your Graduation Degree Matter? (The Honest Truth) The short answer is no, you do not need a computer science or math degree. However, your background will give you a unique superpower that you can leverage: Commerce / BBA / MBA Graduates You already understand business logic, profit margins, and KPIs (Key Performance Indicators). You don’t just analyze data; you understand why the business needs it. Engineering / BCA / BSc Tech Graduates You have a natural edge with logical thinking, systems structure, and algorithmic problem-solving. Learning Python and SQL will feel like a natural extension of your studies. Arts / Humanities / Science Graduates You excel at research, critical thinking, and storytelling. Data analytics is 50% technical and 50% communication—translating complex numbers into simple stories for stakeholders. The Fresher Graduate Blueprint: From Degree to Data Job To get hired over hundreds of other applicants, you need a structured approach. This 4-step execution strategy bridges the gap between your college degree and your first paycheck: Step 1: Master the Entry-Level Tech Stack Do not try to learn everything at once. Focus entirely on the core tools recruiters look for in entry-level resumes: Advanced Excel Learn conditional formatting, complex formulas, and Pivot Tables. A massive portion of business reporting still runs entirely on Excel. SQL The most critical skill. You must know how to write database queries, use JOIN statements, and aggregate data. Power BI Learn to convert ugly rows of data into interactive, visual dashboards. Python Basics Focus specifically on libraries used for handling data, such as Pandas and NumPy. Step 2: Build a Proof-of-Work Portfolio When you graduate, your resume is a blank slate. To get a hiring manager’s attention, you need to show, not just tell. Create a GitHub profile or a personal website containing 3 distinct projects: Project 1 (Data Cleaning) Take a messy, unformatted dataset from the web (like a raw e-commerce sales sheet) and document exactly how you cleaned it using Excel or Python. Project 2 (SQL Exploratory Analysis) Write a script querying a public database to answer a specific business question (e.g., “Which product categories lost the most revenue last quarter?”). Project 3 (Visual Dashboard) Build an interactive dashboard using Power BI or Tableau that highlights key trends at a single glance. Step 3: Target the Right Entry-Level Roles Many freshers make the mistake of applying for “Senior Data Scientist” positions and getting discouraged by rejections. Instead, look for these beginner-friendly job titles: Junior Data Analyst / Analyst Trainee These are heavily mentored roles designed specifically for fresh grads to learn on the job. Reporting Analyst Focuses on keeping weekly or monthly business performance metrics accurate and up to date. Business Intelligence (BI) Assistant Helps maintain enterprise dashboards and handles standard SQL data extraction. Step 4: Upskill on AI Workflows The role of an analyst is evolving. Top companies expect freshers to use AI as a productivity booster. Learn how to use large language models (LLMs) to write boilerplate SQL queries or debug Python syntax errors, making sure you double-check the logic yourself.
Read More

Dashboard Creation in Excel

Creating a dashboard in Excel allows you to turn raw, messy rows of data into a clean, interactive, and one-page visual summary that helps stakeholders make decisions at a glance. An effective dashboard follows a structured, modular architecture. It is best to avoid building everything on a single sheet; instead, organize your workbook into a three-tier system: Tier 1: Raw Data The untouched base data (often imported from SQL or a CSV). Tier 2: Calculation Engine Hidden sheets where Pivot Tables and formulas process the raw data. Tier 3: The Dashboard Canvas The clean, presentation-ready front end with charts, KPIs, and slicers. Step-by-Step Guide to Building an Excel Dashboard Step 1: Prepare and Clean Your Data Before building visuals, ensure your data is structured properly. Related learning: Master in Excel Certificate Course in Vadodara Step 2: Create the Calculation Engine (Pivot Tables) Instead of plotting charts directly from raw data, use Pivot Tables as an intermediate layer to aggregate the metrics. Step 3: Design the Dashboard Canvas (UI/UX Layout) Open a brand new sheet and name it Dashboard. This is your visual canvas. Step 4: Set Up KPI Cards (Key Performance Indicators) KPI cards sit at the very top of your dashboard and display the most critical high-level numbers (e.g., Total Revenue, Net Profit, Total Orders). Step 5: Insert Dynamic Charts Go back to your Calculations sheet, click inside a Pivot Table, and go to PivotTable Analyze > PivotChart. Choose the chart type that best fits the data narrative: Line Charts Best for showing trends over time (e.g., Monthly Revenue). Bar/Column Charts Best for comparisons (e.g., Sales by Product Category). Donut Charts Best for displaying simple asset allocations or percentage contributions (keep slices under 4 for readability). Cut the generated chart (Ctrl + X) and paste it (Ctrl + V) onto your Dashboard sheet. Style the chart to match your chosen color palette, remove unnecessary gridlines inside the chart, and clear out repetitive legends. Related learning: Power BI Course in Vadodara Step 6: Add Interactivity with Slicers Slicers act as visual filters that allow users to customize the data view dynamically. The Golden Rules of Dashboard Design The F-Shape Layout Rule Place your most critical high-level metrics (KPI cards) across the top row or down the left column. Users naturally scan screens in an ‘F’ pattern. Keep it on a Single Screen A true dashboard should not require vertical or horizontal scrolling. Force yourself to fit the core story onto one clean screen view. Context is King A number like $500,000 means nothing without context. Always include a small label underneath it showing a comparison metric, such as +12% vs Last Quarter or Target: $450,000.
Read More

Top 20 Excel Functions Every Data Analyst Must Know

Excel remains the ultimate sandbox for data analytics. Before you load your data into Python or SQL, you will almost always use Excel to inspect, clean, and run quick diagnostics on it. To help you cut through the noise, here are the top 20 Excel functions every data analyst must master, categorized by exactly how you will use them on the job. 1. Lookup and Reference Functions (Finding the Data) These functions are the backbone of data manipulation, allowing you to connect disjointed data tables using common identifiers. 2. Logical and Conditional Functions (Filtering and Branching) Data analysts use these to categorize data, flag specific anomalies, and perform conditional math. 3. Aggregation and Statistical Functions (Summarizing the Data) You cannot analyze data without summarizing it. These functions help you extract quick metrics from thousands of rows. 4. Text Functions (Data Cleaning) Real-world data is notoriously messy. Names have random spaces, IDs are merged together, and formatting is inconsistent. These functions fix that. 5. Date and Time Functions (Trend Analysis) Most business analysis relies heavily on time tracking (e.g., Month-over-Month growth, quarterly targets, or delivery turnarounds). Pro-Tip: While knowing these 20 functions will put you in the top 10% of standard spreadsheet users, always combine them with Pivot Tables and Power Query for advanced, automated data transformations.
Read More

Cracking the Data Code: The Ultimate Guide to the Best Data Analytics Courses in Vadodara

Introduction In today’s digital economy, data has become one of the world’s most valuable assets. Every online purchase, social media interaction, business transaction, healthcare record, and financial operation generates massive amounts of information. Organizations are now leveraging this data to make smarter decisions, improve customer experiences, optimize operations, and gain a competitive edge. This growing reliance on data has created an unprecedented demand for skilled data analysts across industries. From multinational corporations to startups, companies are actively seeking professionals who can transform raw numbers into meaningful business insights. If you’re looking to build a rewarding career in this rapidly expanding field, enrolling in the best Data Analytics Course in Vadodara can be your first step toward success. Whether you’re a student, working professional, business owner, or entrepreneur, this comprehensive guide will help you understand everything about Data Analytics, career opportunities, essential skills, salary expectations, and how to choose the right Data Analytics training institute in Vadodara. What is Data Analytics? Data Analytics is the process of collecting, cleaning, organizing, analyzing, and interpreting data to uncover patterns, trends, and valuable insights that help businesses make informed decisions. Rather than relying on guesswork, organizations use data analytics to answer critical questions such as: Data analytics transforms complex datasets into meaningful information that drives smarter business decisions. Why Data Analytics is One of the Fastest Growing Careers The world generates over 328 million terabytes of data every day, and this number continues to grow rapidly. Organizations need skilled professionals who can analyze this information and convert it into actionable strategies. Industries hiring Data Analysts include: As businesses become increasingly data-driven, the demand for qualified analysts continues to rise. Why Learn Data Analytics in Vadodara? Vadodara has evolved into one of Gujarat’s fastest-growing educational and industrial hubs. The city is home to numerous IT companies, manufacturing industries, startups, and multinational organizations that require data-driven decision-making. Advantages of studying Data Analytics in Vadodara include: Students can build job-ready skills without relocating to cities like Bangalore, Pune, or Hyderabad. Skills You’ll Learn in a Data Analytics Course A professional Data Analytics Training program should cover both technical and analytical skills. Microsoft Excel Excel remains one of the most widely used analytics tools. You’ll learn: SQL SQL is essential for retrieving and managing data stored in databases. Topics include: Python Python is among the most popular programming languages for data analytics. You’ll learn: Power BI Power BI enables professionals to create interactive business dashboards. Skills include: Tableau Tableau is a leading visualization platform used by businesses worldwide. Students learn: Statistics Strong statistical knowledge helps analysts interpret data correctly. Topics include: Who Should Join a Data Analytics Course? A Data Analytics Course is suitable for: No prior coding experience is required for beginner-level programs. Career Opportunities After Data Analytics Training After completing a professional certification, you can apply for roles such as: The demand for these roles continues to grow across sectors. Salary of Data Analysts in India Salary depends on skills, certifications, experience, and location. Approximate salary ranges: Experience Average Annual Salary Fresher ₹3.5 – ₹6 LPA 2–4 Years ₹6 – ₹10 LPA 5–8 Years ₹10 – ₹18 LPA Senior Analyst ₹18 – ₹30+ LPA Professionals skilled in Python, SQL, Power BI, and cloud analytics often command higher salaries. Features of the Best Data Analytics Course in Vadodara When choosing a training institute, ensure it offers: Industry-Oriented Curriculum The course should cover: Live Projects Practical learning is essential. Students should work on: Experienced Trainers Learn from professionals with real-world industry experience who can bridge the gap between theory and practice. Placement Assistance A good institute should provide: Flexible Learning Options Choose between: How to Choose the Best Data Analytics Institute in Vadodara Before enrolling, evaluate these factors: Investing time in selecting the right institute can significantly impact your career growth. Why Hands-On Projects Matter Employers value practical experience as much as theoretical knowledge. Working on real datasets helps you: Projects also make your resume stand out in a competitive job market. Frequently Asked Questions Is coding mandatory for Data Analytics? No. Beginners can start with Excel and SQL. Python is introduced gradually, making it accessible even without a programming background. How long does a Data Analytics Course take? Most comprehensive courses range from 3 to 6 months, depending on the curriculum and learning mode. Can non-IT students learn Data Analytics? Yes. Students from Commerce, Arts, Science, Engineering, and Management backgrounds can successfully transition into Data Analytics with proper training. Which tools are most important? The core tools include: These are widely used across industries. Is Data Analytics a good career in 2026 and beyond? Absolutely. As businesses continue to embrace digital transformation and data-driven decision-making, the demand for skilled Data Analysts is expected to remain strong across sectors. Final Thoughts Data Analytics is no longer just a technical skill—it’s a strategic capability that powers innovation, efficiency, and smarter decision-making in virtually every industry. For students, professionals, and entrepreneurs in Vadodara, gaining expertise in analytics can unlock exciting career opportunities and provide a competitive advantage in the job market. When selecting a Data Analytics Course in Vadodara, prioritize institutes that emphasize practical learning, real-world projects, mentorship from experienced professionals, and career support. A well-rounded program should equip you with essential tools like Excel, SQL, Python, Power BI, Tableau, and statistics while helping you build a portfolio that demonstrates your capabilities. The right training can do more than prepare you for your first job—it can lay the foundation for a long-term career in business intelligence, data visualization, analytics consulting, or even data science. As organizations increasingly rely on data to shape strategy, professionals with strong analytical skills will continue to be in high demand. Whether you’re starting your career, looking to upskill, or planning a career transition, now is an excellent time to invest in data analytics and become part of one of the fastest-growing professions in the digital economy.

Read More

Creating Interactive Dashboards IN Power BI

While Excel is fantastic for quick data manipulation and prototyping, Microsoft Power BI is the industry standard for enterprise-grade, interactive data storytelling. It can easily handle millions of rows, connect directly to cloud databases, and auto-refresh reports in real time. Building a Power BI dashboard requires a structured, end-to-end framework often called the Data Pipeline lifecycle. Here is the step-by-step process to build a high-performing interactive dashboard. The 4-Step Power BI Architecture Step-by-Step Dashboard Build Step 1: Get & Transform Data (Power Query) Before you drop charts onto your canvas, you must ensure your data is clean and uniform. 1. Click Get Data in Power BI Desktop and select your source (SQL Database, Excel, Web, CSV, etc.). 2. Click Transform Data to open the Power Query Editor. 3. Perform standard data hygeine: Fix Data Types: Ensure date columns are formatted as `Date`, and monetary values are `Fixed Decimal Number`. Remove Nulls/Duplicates: Clean out empty rows or corrupted records. Unpivot Columns: Transform wide tables (e.g., columns for Jan, Feb, Mar) into long, narrow analytical tables for faster processing. Step 2: Establish the Semantic Model (Data Modeling) A common mistake beginner make is dumping everything into one giant flat spreadsheet. For complex, responsive dashboards, map your data into a Star Schema layout within the Model View: Fact Tables: Your central transaction table containing numeric values and metrics (e.g., `Fact_Sales` with Revenue, Quantity, OrderDate). Dimension Tables: Surrounding lookup tables containing descriptive attributes (e.g., `Dim_Customers`, `Dim_Products`, `Dim_Geography`). Relationships: Create 1-to-Many (`1:*`) relationships** linking unique IDs from your Dimension tables to the matching keys in your Fact table. Ensure cross-filter directions are set to single for optimal speed. Step 3: Write Key Metrics (DAX Fundamentals) Do not drag raw numeric columns directly onto charts. Instead, build explicit calculations using DAX (Data Analysis Expressions). Create a dedicated table to house your measures, and start with core business metrics: Total Revenue: “`dax Total Revenue = SUM(Fact_Sales[Revenue Amount]) Year-Over-Year (YoY) Growth: “`dax YoY Revenue Growth = VAR CurrentYearSales = [Total Revenue] VAR LastYearSales = CALCULATE([Total Revenue], SAMEPERIODLASTYEAR(‘Dim_Date'[Date])) RETURN DIVIDE(CurrentYearSales – LastYearSales, LastYearSales, 0) Step 4: Build the Visual Interface Switch to the Report View to begin designing your user experience. 1. Set Up the Canvas Background: Choose a professional layout. You can use a very light grey background (`#F3F4F6`) with crisp white visual containers to help charts pop cleanly. 2. KPI Headline Cards: Place standard card visuals across the top of your report to show key summaries (`Total Revenue`, `Profit Margin`, `Total Active Users`). 3. Choose the Right Core Visuals: Time-Series Analysis: Use a Line Chart to map trend variations over months or quarters. Categorical Breakdowns: Use a Clustered Bar Chart to evaluate product categories or regional performance. Contribution Analysis: Use a Matrix Visual for a structured drill-down look at financial numbers. Engineering Advanced Interactivity Power BI shines brightest through its native slice-and-dice interaction layers. Make sure to activate these three features to build a dynamic app-like experience: 1. Cross-Filtering and Highlights By default, clicking on a specific data segment in one chart (e.g., selecting “Electronics” on a bar chart) will automatically highlight or filter all other charts on the page. Pro-Tip: If you want a specific chart to remain unchanged when filters are clicked, go to the Format tab, click Edit Interactions, and select the None icon on that visual. 2. Drill-Through Actions Instead of cluttering a single screen with details, let users deep-dive into specifics. Create a secondary, detailed page (e.g., *Customer Deep Dive*). Drag the `Customer Name` field into the **Drill-through filters** well on that second page. Now, users can right-click any customer name on the main dashboard and instantly jump to that person’s detailed transaction history. 3. Tooltip Canvas Overlays Standard tooltips display basic numbers when a user hovers over a chart element. Power BI allows you to design an entirely separate miniature page and use it as a custom hover card. Hovering over a regional map, for example, can trigger a mini tooltip line graph showing that specific region’s 12-month sales trajectory. The Pro Dashboard Checklist Keep Slicers Collapsible: Use the Bookmarks and Selection Pane to build a slide-out filter panel. This keeps your canvas clean and maximizes real estate for your core charts. The 5-Second Test: A stakeholder should look at your dashboard and understand the top core business insight within 5 seconds without scrolling. Limit Color Variance: Use a single cohesive brand theme. Use neutral tones for 90% of the dashboard elements, reserving a vibrant action color (like navy blue or teal) exclusively to draw eyes to critical anomalies or targets.


Read More

Best IT Courses for School Students to Start Early Career

In today’s fast-changing digital world, learning IT skills at an early age can give students a strong advantage. School students who start learning technology early develop better problem-solving skills, creativity, and confidence. If you are looking for the best IT courses for school students, starting with the right courses can shape a successful future in technology. Why Should School Students Learn IT Skills Early? Learning IT skills is no longer optional—it’s essential. Key Benefits: Improves logical thinking Builds computer knowledge Prepares for future careers Increases confidence in studies Opens global career opportunities Top IT Courses for School Students Here are the most useful and beginner-friendly IT courses students can start with: 1. Python Programming Python is one of the easiest programming languages and perfect for beginners. 🔹 What Students Learn: Basics of coding Logic building Simple projects 🔹 Why Choose Python? Easy to understand Used in AI, Data Science, and Web Development High demand skill C Programming C programming helps students build strong coding fundamentals. 🔹 Benefits: Strong logic development Understanding of how programming works Base for advanced languages C++ Programming C++ is an advanced language used in software and game development. 🔹 What Students Learn: Object-Oriented Programming Advanced coding concepts Real-world applications Basic Computer Courses Before coding, students should understand computer basics. 🔹 Topics Covered: MS Office (Word, Excel, PowerPoint) Internet usage Basic computer operations Web Development (Beginner Level) Students can also start learning how websites are created. 🔹 Skills Covered: HTML & CSS basics Website structure Designing simple web pages Introduction to AI & Future Technologies Early exposure to AI helps students understand future career paths. 🔹 Topics: Basics of Artificial Intelligence Real-world AI applications Intro to automation Why Choose KS Technologies? If you are searching for the best IT training institute for school students, KS Technologies offers beginner-friendly courses designed for early learners. 👉 Explore Courses: https://www.kstechnologies.co/ 🌟 Key Features: ✅ Simple and easy teaching methods ✅ Practical learning approach ✅ Experienced trainers ✅ Certification after course completion ✅ Courses designed for beginners How to Choose the Right Course? Here’s a simple guide: Beginner: Start with Basic Computer + Python Intermediate: Move to C Programming Advanced: Learn C++ or Web Development Career Opportunities After Learning IT Skills Starting early opens many career paths in the future: Software Developer Web Developer Data Analyst AI Engineer Game Developer Final Thoughts The earlier students start learning IT skills, the better their future opportunities. Whether it’s coding, web development, or basic computer knowledge, every skill adds value. If you want to give your child a strong start in technology, enrolling in the right course at the right time is the key. Get Started Today Start your IT journey with expert guidance and practical learning. 👉 Visit: https://www.kstechnologies.co/ 👉 Enroll in beginner-friendly IT courses today
Read More

FAQs

We offer a wide range of job oriented courses including coding (Python, Java, C, C++), Data Science, Data Analytics, Power BI, AI – ML and more. Our courses cater to both beginners and experienced professionals.
Yes, all of our instructors are industry professionals with extensive experience and expertise in their respective fields. They bring real-world knowledge and practical insights to the training.
Yes. All our courses curriculum is 100% practical with assignments and projects.
Yes. We will provide internationally recognized certificate after the successful completion of the course.
Yes, we offer both in-person and online courses to accommodate different learning preferences and schedules. Our online courses are interactive and designed for flexible learning.
We provide personalized career counseling, resume building, and interview preparation. We offer job placement assistance through partnerships with employers and internships. Additionally, we offer access to an alumni network and continuous learning opportunities to enhance career growth.
The prerequisites vary by course. Some courses require basic computer knowledge, while others may require prior experience in related fields. Please check individual course details for specific requirements.
Yes, we offer free introductory sessions, webinars, and free demo classes for certain courses. We also provide free learning resources, such as study guides and tutorials, for enrolled students.
You can enroll in a course by visiting our website, filling out the application form, or contacting our admissions team for assistance. We will guide you through the registration process.